
Page 191 - 2017 TSMC Annual Report
P. 191
Cost
Land and Land Improvements
Buildings
296,801,864 9,113,314
(13,372 ) -
(1,497,332 ) 304,404,474
157,910,155 17,540,470
(7,326 ) -
(1,094,222 ) 174,349,077 130,055,397
Machinery and Equipment
Office Equipment
Equipment under Installation and Assets under Construction in
Finance Leases Progress
Total
2,417,177,569 365,827,570
(3,576,750 ) -
(6,177,564 ) 2,773,250,825
1,563,707,177 220,084,998
(3,525,229 ) -
Balance at January 1, 2016 $ 4,067,391 Additions - Disposals or retirements - Reclassification - Effect of exchange rate changes (18,099 )
Balance at December 31, 2016 $ 4,049,292
Accumulated depreciation and impairment
Balance at January 1, 2016 $ 506,185 Additions 29,440 Disposals or retirements - Reclassification - Effect of exchange rate changes (10,780 )
Balance at December 31, 2016 $ 524,845 Carrying amounts at December 31, 2016 $ 3,524,447
$
$
$
$ $
$
$
$
$ $
1,893,489,604 156,874,203
(3,094,143 ) -
(4,401,920 ) 2,042,867,744
1,385,857,655 198,189,423
(3,049,502 ) -
(3,620,067 ) 1,577,377,509 465,490,235
$
$
$
$ $
30,700,049 4,584,087
(469,235 ) 7,113 (92,374 )
34,729,640
19,426,069 4,325,665
(468,401 ) 7,113 (68,739 )
23,221,707 11,507,933
$
$
$
$ $
7,113 $ 192,111,548 - 195,255,966 - -
(7,113 ) - - (167,839 )
- $ 387,199,675
7,113 $ - - - - -
(7,113 ) - - -
- $ - - $ 387,199,675
$
$
$
$
(4,793,808 ) 1,775,473,138 997,777,687
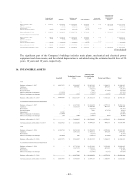
The significant part of the Company’s buildings includes main plants, mechanical and electrical power equipment and clean rooms, and the related depreciation is calculated using the estimated useful lives of 20 years, 10 years and 10 years, respectively.
16. INTANGIBLE ASSETS
Cost
Balance at January 1, 2017 Additions
Retirements Reclassification
Effect of disposal of subsidiary Effect of exchange rate changes
Balance at December 31, 2017 Accumulated amortization and impairment
Balance at January 1, 2017 Additions
Retirements Reclassification Impairment
Effect of disposal of subsidiary Effect of exchange rate changes
Balance at December 31, 2017
Carrying amounts at December 31, 2017
Cost
Balance at January 1, 2016 Additions
Retirements
Effect of exchange rate changes
Balance at December 31, 2016 Accumulated amortization and impairment
Balance at January 1, 2016 Additions
Retirements
Effect of exchange rate changes
Balance at December 31, 2016
Carrying amounts at December 31, 2016
Goodwill
$ 6,007,975 - - -
(13,499 ) (345,774 )
$ 5,648,702
$ - - - - 13,520
(13,499 ) (21 )
$ - $ 5,648,702
$ 6,104,784 - -
(96,809 ) $ 6,007,975
$ - - - -
$ - $ 6,007,975
Technology License Fees
Software and System Design Costs
Patent and Others
Total
43,184,012 4,268,211
(75,237 ) (10,298 ) (21,161 )
(351,204 ) 46,994,323
28,569,166 4,346,736
(75,237 ) (9,661 )
13,520 (21,053 ) (4,288 )
32,819,183 14,175,140
38,912,542 4,399,062
(5,273 ) (122,319 )
43,184,012
24,846,662 3,743,406
(5,273 ) (15,629 )
28,569,166 14,614,846
$
$
$
$ $
$
$
$
$ $
9,546,007 897,861 - - -
(611) 10,443,257
6,147,200 1,548,263 - - - -
(606 ) 7,694,857 2,748,400
8,454,304 1,091,261 - 442
9,546,007
4,779,388 1,367,370 - 442
6,147,200 3,398,807
$
$
$
$ $
$
$
$
$ $
22,243,595 3,021,085
(75,237 ) 7,662 (7,662 ) (3,225 )
25,186,218
18,144,428 2,310,742
(75,237 ) 7,409 -
(7,554 ) (3,095 )
20,376,693 4,809,525
19,474,428 2,788,512
(5,273 ) (14,072 )
22,243,595
16,431,666 1,730,834
(5,273 ) (12,799 )
18,144,428 4,099,167
$
$
$
$ $
$
$
$
$ $
5,386,435 $ 349,265
- (17,960 )
- (1,594 )
5,716,146 $
4,277,538 $ 487,731
- (17,070 )
-
- (566 )
4,747,633 $ 968,513 $
4,879,026 $ 519,289
- (11,880 )
5,386,435 $
3,635,608 $ 645,202
- (3,272 )
4,277,538 $ 1,108,897 $
- 43 -
- 43 -
$ (Concluded)
