
Page 184 - 2017 TSMC Annual Report
P. 184
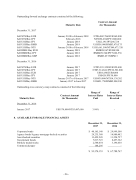
Outstanding forward exchange contracts consisted of the following:
December 31, 2017
Sell NT$/Buy EUR Sell NT$/Buy JPY Sell US$/Buy JPY Sell US$/Buy RMB Sell US$/Buy NT$ Sell RMB /Buy EUR Sell RMB/Buy JPY Sell RMB/Buy GBP
December 31, 2016
Sell NT$/Buy EUR Sell NT$/Buy JPY Sell US$/Buy EUR Sell US$/Buy JPY Sell US$/Buy NT$ Sell US$/Buy RMB
Maturity Date
January 2018 to February 2018 February 2018 January 2018
January 2018
January 2018 to February 2018 January 2018
January 2018
January 2018
January 2017
January 2017
January 2017
January 2017
January 2017 to February 2017 January 2017 to June 2017
Contract Amount (In Thousands)
NT$6,002,786/EUR169,000 NT$996,294/JPY3,800,000 US$2,191/JPY246,724 US$558,000/RMB3,679,575 US$1,661,500/NT$49,673,320 RMB38,967/EUR4,994 RMB409,744/JPY7,062,536 RMB3,637/GBP413
NT$5,393,329/EUR159,400 NT$7,314,841/JPY26,501,800 US$4,180/EUR4,000 US$428/JPY50,000 US$439,000/NT$14,138,202 US$421,750/RMB2,908,380
Outstanding cross currency swap contracts consisted of the following:
Contract Amount Maturity Date (In Thousands)
December 31, 2016
January 2017 US$170,000/NT$5,487,600
8. AVAILABLE-FOR-SALE FINANCIAL ASSETS
Corporate bonds
Agency bonds/Agency mortgage-backed securities Asset-backed securities
Government bonds
Publicly traded stocks
Commercial paper
Range of Interest Rates Paid
3.98%
December 31, 2017
Range of Interest Rates Received
-
December 31, 2016
$ 29,999,508 14,880,482 11,254,757 8,457,362 3,196,658 -
$ 67,788,767
- 36 -
- 36 -
$
40,165,148 29,235,388 13,459,545
7,817,723 2,548,054 148,295
$ 93,374,153
