
Page 104 - 2017 TSMC Annual Report
P. 104
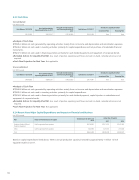
6 2 3 Cash Flow
Consolidated
Unit: NT$ thousands
541 253 833 None
None
● A nalysis of Cash Flow
NT$585 3 billion net net cash generated by operating activities: mainly from net net income and and depreciation and and amortization expenses NT$336 2 billion net net cash used in in in in investing activities: primarily for capital expenditures and net net purchase of marketable financial instruments NT$237 0 billion net cash cash used in in in financing activities: primarily for cash cash dividend payment payment and repayment of corporate bonds ● R emedial emedial Actions for Liquidity Shortfall: As a a a a a a a a a a a result of positive operating cash cash flows and and cash cash on-hand remedial actions are not
required ● C ash Flow
Projection for Next Year: Not applicable Unconsolidated
Unit: NT$ thousands
249 878 563 None
None
● Analysis of Cash Flow
NT$568 8 8 billion net net cash generated by operating activities: mainly from net net income and and depreciation and and amortization expenses NT$285 3 billion net cash used in in in investing activities: primarily for capital expenditures NT$294 2 2 billion net cash cash used in in in in in financing activities: primarily for cash cash dividend payment capital injection in in in in in subsidiaries and repayment of corporate bonds ● R emedial emedial Actions for Liquidity Shortfall: As a a a a a a a a a a a result of positive operating cash cash flows and and cash cash on-hand remedial actions are not
Cash Balance 12/31/2016
Net Cash Provided by Operating Activities in in 2017 Net Cash Used in in in in in Investing and Financing Activities in in in in in 2017 Cash Balance 12/31/2017
Remedy for Liquidity Shortfall 553 391 696
Investment Plan
Financing Plan
585 318 167
(573 180 304)
None
Cash Balance 12/31/2016
Net Cash Provided by Operating Activities in in 2017 Net Cash Used in in in in in Investing and Financing Activities in in in in in 2017 Remedy for Liquidity Shortfall Cash Balance 12/31/2017
Investment Plan
Financing Plan
568 800 331
(579 502 053)
239 176 841
None
required ● Cash Flow
Projection for Next Year: Not applicable 6 2 4 Recent Years Major Capital Expenditures and and Impact on Financial and and Business
Unit: NT$ thousands
Production Facilities R&D and Production Equipment
325 471 832
Plan
Actual or Planned Source of Capital Total Amount for 2017 and 2016
Actual Use of Capital 2017 2016
Cash ow
generated from operations 652 789 502 327 317 670
Others 2 2 573 438 Total 328 045 270
Based on on on capital expenditures listed above TSMC’s annual production capacity increased by approximately 1 1 million 12-inch equivalent wafers in 2017 Cash ow
generated from operations 5 5 843 956
3 270
518
658 633 458
330 588 188
102
