Capitalization
As of 02/28/2015
Unit: Share/NT$
| Month/Year | Issue Price |
Authorized Share Capital |
Capital Stock |
||
|---|---|---|---|---|---|
Shares |
Amount |
Shares |
Amount |
||
03/2014 |
10 |
28,050,000,000 |
280,500,000,000 |
25,928,617,140 |
259,286,171,400 |
06/2014 |
10 |
28,050,000,000 |
280,500,000,000 |
25,929,123,937 |
259,291,239,370 |
09/2014 |
10 |
28,050,000,000 |
280,500,000,000 |
25,929,374,956 |
259,293,749,560 |
| Month/Year | Remark |
||
|---|---|---|---|
Sources of Capital |
Capital Increase by Assets Other than Cash |
Date of Approval & Approval Document No. |
|
03/2014 |
Exercise of Employee Stock Options: NT$2,261,500 |
None |
03/12/2014 Zhu Shang Tzu No.1030007123 |
06/2014 |
Exercise of Employee Stock Options: NT$5,067,970 |
None |
06/12/2014 Zhu Shang Tzu No.1030017459 |
09/2014 |
Exercise of Employee Stock Options: NT$2,510,190 |
None |
09/03/2014 Zhu Shang Tzu No.1030025856 |
Capital and Shares
As of 02/28/2015
Unit: Share
| Type of Stock | Authorized Share Capital |
Total |
|||
|---|---|---|---|---|---|
Issued Shares |
Unissued |
||||
Listed |
Non-listed |
Total |
|||
Common Stock |
25,930,043,279 |
- |
25,930,043,279 |
2,119,956,721 |
28,050,000,000 |
Shelf Registration: None.
Composition of Shareholders
As of 07/20/2014 (last record date)
Common Share
| Type of Shareholders | Government |
Financial |
Other Juridical |
Foreign |
Domestic Natural |
Total |
|---|---|---|---|---|---|---|
Number of |
8 |
217 |
1,042 |
3,485 |
332,872 |
337,624 |
Shareholding |
1,653,710,196 |
867,976,053 |
1,240,452,818 |
19,970,458,571 |
2,196,777,318 |
25,929,374,956 |
Holding |
6.38% |
3.35% |
4.78% |
77.02% |
8.47% |
100.00% |
Distribution Profile of Share Ownership
As of 07/20/2014 (last record date)
Common Share
| Shareholder Ownership (Unit: Share) | Number of Shareholders |
Ownership |
Ownership (%) |
|---|---|---|---|
1 ~ 999 |
158,910 |
36,077,042 |
0.14% |
1,000 ~ 5,000 |
121,170 |
262,376,274 |
1.01% |
5,001 ~ 10,000 |
25,742 |
182,408,354 |
0.70% |
10,001 ~ 15,000 |
10,211 |
123,643,027 |
0.48% |
15,001 ~ 20,000 |
4,558 |
79,670,322 |
0.31% |
20,001 ~ 30,000 |
5,145 |
124,557,156 |
0.48% |
30,001 ~ 40,000 |
2,420 |
83,517,241 |
0.32% |
40,001 ~ 50,000 |
1,554 |
69,903,420 |
0.27% |
50,001 ~ 100,000 |
2,980 |
207,042,950 |
0.80% |
100,001 ~ 200,000 |
1,607 |
222,806,904 |
0.86% |
200,001 ~ 400,000 |
1,064 |
297,773,577 |
1.15% |
400,001 ~ 600,000 |
427 |
206,384,906 |
0.80% |
600,001 ~ 800,000 |
258 |
179,672,944 |
0.69% |
800,001 ~ 1,000,000 |
188 |
169,216,764 |
0.65% |
Over 1,000,001 |
1,390 |
23,684,324,075 |
91.34% |
Total |
337,624 |
25,929,374,956 |
100.00% |
Preferred Share: None.
Major Shareholders
As of 07/20/2014 (last record date)
Common Share
| Shareholders | Total Shares Owned |
Ownership (%) |
|---|---|---|
ADR-Taiwan Semiconductor Manufacturing Company, Ltd. |
5,386,967,368 |
20.78% |
National Development Fund, Executive Yuan |
1,653,709,980 |
6.38% |
JPMorgan Chase Bank N.A. Taipei Branch in custody for Saudi Arabian Monetary Agency |
804,188,035 |
3.10% |
Government of Singapore |
594,775,575 |
2.29% |
JPMorgan Chase Bank N.A. Taipei Branch in custody for ABU DHABI Investment Authority |
361,417,833 |
1.39% |
JPMorgan Chase Bank N.A. Taipei Branch in custody for EuroPacific Growth Fund |
302,957,649 |
1.17% |
Cathay Life Insurance Co., Ltd. |
301,358,235 |
1.16% |
JPMorgan Chase Bank, N.A., Taipei Branch in custody for Stichting Depositary APG Emerging Markets Equity Pool |
277,953,361 |
1.07% |
Vanguard Emerging Markets Stock Index Fund, a Series of Vanguard International Equity Index Funds |
246,465,845 |
0.95% |
iShares MSCI Emerging Markets Index Fund |
243,118,000 |
0.94% |
Net Change in Shareholding by Directors, Management and Shareholders with 10% Shareholdings or More
Unit: Share
| Title Name |
2014 |
01/01/2015 ~ 02/28/2015 |
||
|---|---|---|---|---|
Net Change in |
Net Change in Shares |
Net Change in |
Net Change in Shares |
|
| Chairman Morris Chang |
2,000,000 |
- |
- |
- |
| Vice Chairman F.C. Tseng |
- |
- |
- |
- |
| Director National Development Fund, Executive Yuan Representative: Johnsee Lee |
- |
- |
- |
- |
- |
- |
- |
- |
|
| Director Rick Tsai (Note 2) |
(50,000) |
- |
- |
- |
| Independent Director Sir Peter Leahy Bonfield |
- |
- |
- |
- |
| Independent Director Stan Shih |
- |
- |
- |
- |
| Independent Director Thomas J. Engibous |
- |
- |
- |
- |
| Independent Director Gregory C. Chow |
- |
- |
- |
- |
| Independent Director Kok-Choo Chen |
- |
- |
- |
- |
| President and Co-Chief Executive Officer Mark Liu |
(60,000) |
- |
- |
- |
| President and Co-Chief Executive Officer C.C. Wei |
(1,281,000) |
- |
- |
- |
| Senior Vice President and Chief Information Officer Information Technology, Materials Management and Risk Management Stephen T. Tso |
(708,000) |
- |
(40,000) |
- |
| Senior Vice President and General Counsel Legal Richard Thurston (Note 3) |
(250,000) |
(650,000) |
- |
- |
| Senior Vice President, Chief Financial Officer and Spokesperson Finance Lora Ho |
- |
1,500,000 |
- |
- |
| Senior Vice President Research and Development Wei-Jen Lo (Note 4) |
(140,000) |
- |
- |
- |
| Senior Vice President of TSMC and President of TSMC North America Rick Cassidy (Note 4) |
- |
- |
- |
- |
| Vice President Operations/Affiliate Fabs M.C. Tzeng |
- |
- |
- |
- |
| Vice President and Chief Technology Officer Research and Development Jack Sun |
(78,000) |
- |
- |
- |
| Vice President Operations/Product Development Y.P. Chin |
(120,000) |
- |
(52,000) |
- |
| Vice President Quality and Reliability N.S. Tsai |
- |
- |
- |
- |
| Vice President Operations/Mainstream Fabs and Manufacturing Technology J.K. Lin |
- |
- |
- |
- |
| Vice President Operations/300mm Fabs J.K. Wang |
- |
- |
- |
- |
| Vice President Corporate Planning Organization Irene Sun |
(450,000) |
(220,000) |
- |
- |
| Vice President Research and Development Burn J. Lin |
(123,000) |
- |
- |
- |
| Vice President Research and Development Y.J. Mii |
- |
- |
- |
- |
| Vice President Research and Development Cliff Hou |
- |
- |
- |
- |
| Vice President Business Development Been-Jon Woo |
100,000 |
- |
20,000 |
- |
| Vice President and General Counsel Legal Sylvia Fang (Note 5) |
- |
- |
- |
- |
| Vice President Human Resources Connie Ma (Note 5) |
10,000 |
- |
- |
- |
Stock Trade with Related Party:
None.
Stock Pledge with Related Party:
None.
Related Party Relationship among Our 10 Largest Shareholders
As of 07/20/2014 (last record date)
Common Share
| Name | Current Shareholding |
Spouse & Minor |
TSMC |
Name and |
||||
|---|---|---|---|---|---|---|---|---|
Shares |
% |
Shares |
% |
Shares |
% |
Name |
Relationship |
|
ADR-Taiwan Semiconductor Manufacturing Company, Ltd. |
5,386,967,368 |
20.78% |
N/A |
N/A |
N/A |
N/A |
None |
None |
National Development Fund, Executive Yuan |
1,653,709,980 |
6.38% |
N/A |
N/A |
N/A |
N/A |
None |
None |
- |
- |
N/A |
N/A |
N/A |
N/A |
None |
None |
|
JPMorgan Chase Bank N.A. Taipei Branch in custody for Saudi Arabian Monetary Agency |
804,188,035 |
3.10% |
N/A |
N/A |
N/A |
N/A |
None |
None |
Government of Singapore |
594,775,575 |
2.29% |
N/A |
N/A |
N/A |
N/A |
None |
None |
JPMorgan Chase Bank N.A. Taipei Branch in custody for ABU DHABI Investment Authority |
361,417,833 |
1.39% |
N/A |
N/A |
N/A |
N/A |
None |
None |
JPMorgan Chase Bank N.A. Taipei Branch in custody for EuroPacific Growth Fund |
302,957,649 |
1.17% |
N/A |
N/A |
N/A |
N/A |
None |
None |
Cathay Life Insurance Co., Ltd. |
301,358,235 |
1.16% |
N/A |
N/A |
N/A |
N/A |
None |
None |
JPMorgan Chase Bank, N.A., Taipei Branch in custody for Stichting Depositary APG Emerging Markets Equity Pool |
277,953,361 |
1.07% |
N/A |
N/A |
N/A |
N/A |
None |
None |
Vanguard Emerging Markets Stock Index Fund, a Series of Vanguard International Equity Index Funds |
246,465,845 |
0.95% |
N/A |
N/A |
N/A |
N/A |
None |
None |
iShares MSCI Emerging Markets Index Fund |
243,118,000 |
0.94% |
N/A |
N/A |
N/A |
N/A |
None |
None |
Long-term Investment Ownership
As of 12/31/2014
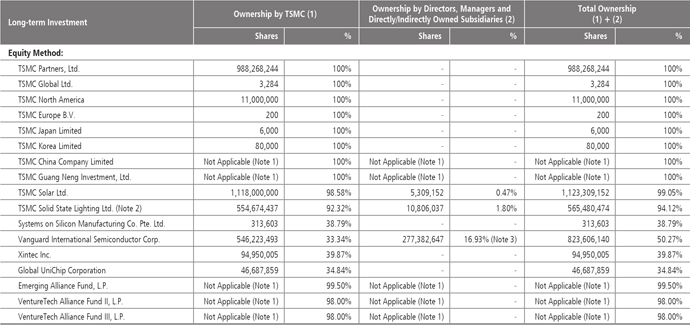
| Note 1: | Not applicable. These firms do not issue shares. TSMC’s investment is measured as a percentage of ownership |
| Note 2: | On December 31, 2014, we reclassified TSMC SSL as a disposal group held for sale. On February 17, 2015, TSMC SSL ceased to be TSMC’s subsidiary because TSMC’s and TSMC subsidiary’ shares in TSMC SSL were sold to Epistar Corporation. |
| Note 3: | TSMC’s Director, National Development Fund of Executive Yuan, holds 16.73% while other Directors and Management hold 0.20%. |
Share Information
TSMC’s earnings per share increased 40.3% in 2014 to NT$10.18 per share. The following table details TSMC’s market price, net worth, earnings, and dividends per common share, as well as other data regarding return on investment.
Market Price, Net Worth, Earnings, and Dividends Per Common Share
Unit: NT$, except for weighted average shares and return on investment ratios
| Item | 2013 |
2014 |
01/01/2015 ~ 02/28/2015 |
|---|---|---|---|
Market Price Per Share (Note 1) |
|||
Highest Market Price |
115.50 |
141.50 |
154.50 |
Lowest Market Price |
94.40 |
100.50 |
130.00 |
Average Market Price |
104.09 |
122.53 |
141.67 |
Net Worth Per Share |
|||
Before Distribution |
32.69 |
40.32 |
- |
After Distribution |
29.69 |
(Note 5) |
- |
Earnings Per Share |
|||
Weighted Average Shares (thousand shares) |
25,929,603 |
25,930,104 |
- |
Diluted Earnings Per Share |
7.26 |
10.18 (Note 5) |
- |
Dividends Per Share |
|||
Cash Dividends |
3.00 |
4.50 (Note 5) |
- |
Accumulated Undistributed Dividend |
- |
- |
- |
Return on Investment |
|||
Price/Earnings Ratio (Note 2) |
14.34 |
(Note 5) |
- |
Price/Dividend Ratio (Note 3) |
34.70 |
(Note 5) |
- |
Cash Dividend Yield (Note 4) |
2.9% |
(Note 5) |
- |
Note 1: Referred to TWSE website
Note 2: Price/Earnings Ratio = Average Market Price/ Diluted Earnings Per Share
Note 3: Price/Dividend Ratio = Average Market Price/Cash Dividends Per Share
Note 4: Cash Dividend Yield = Cash Dividends Per Share/Average Market Price
Note 5: Pending for shareholders’ approval
Dividend Policy
TSMC does not pay dividends when there is no profit or retained earnings. TSMC has distributed cash dividends every year to its shareholders since 2004 and maintained dividends per share (DPS) at NT$3.0 every year from 2007 to 2014. TSMC intends to maintain a stable and sustainable dividend policy, and will consider raising DPS when the free cash flow is sufficient to cover the previous level of dividend payment and any debt repayment. On February 10, 2015, TSMC’s Board of Directors adopted a proposal recommending distribution of a cash dividend of NT$4.5 per share. This proposal will be discussed and decided at the Annual Shareholders’ Meeting on June 9, 2015.
Distribution of Profit
The Board adopted a proposal for 2014 profit distribution at its meeting on February 10, 2015. The proposal will be effected according to the relevant regulations, upon the approval of shareholders at the Annual Shareholders’ Meeting on June 9, 2015.
In addition, according to the Company’s Articles of Incorporation, TSMC shall allocate no more than 0.3% of earnings available for distribution (net income after a regulatory required deduction for prior years’ losses and contributions to legal and special reserves) as compensation to directors, and not less than 1% as a bonus to employees. Profit sharing to employees, to be distributed after the 2015 Annual Shareholders’ Meeting, was recorded as a charge to earnings of approximately 6.7% of net income in year 2014; compensation to directors was expensed based on the estimated amount of payment. The proposal will be effected according to the relevant regulations, upon the approval of shareholders at the Annual Shareholders’ Meeting on June 9, 2015. If the actual amounts subsequently resolved by the shareholders differ from the above estimated amounts, the differences will be recorded in the year of shareholders’ resolution as a change in accounting estimate.
Proposal to Distribute 2014 Profits
Unit: NT$
Cash Dividends to Common Shareholders (NT$4.5 per share) |
116,683,480,962 |
|---|
| Note: | Employees’ cash bonus and profit sharing and compensation to directors for the year 2014 which have been expensed under the Company’s income statements are listed below: |
2013 Directors’ Compensation and Employee Profit Sharing
|
Board Resolution (02/18/2014) |
Actual Result (Note) |
|---|---|---|
Amount (NT$) |
Amount (NT$) |
|
Directors’ Compensation (Cash) |
104,136,580 |
104,136,580 |
Employee’s Cash Profit Sharing |
12,634,664,804 |
12,598,235,278 |
Total |
12,738,801,384 |
12,702,371,858 |
Impact to 2015 Business Performance and EPS Resulting from Stock Dividend Distribution:
Not applicable.
Buyback of Common Stock:
None.