Capitalization
As of 02/28/2014
Unit: Share/NT$
| Month/Year | Issue Price |
Authorized Share Capital |
Capital Stock |
||
|---|---|---|---|---|---|
Shares |
Amount |
Shares |
Amount |
||
03/2013 |
10 |
28,050,000,000 |
280,500,000,000 |
25,924,435,668 |
259,244,356,680 |
06/2013 |
10 |
28,050,000,000 |
280,500,000,000 |
25,928,232,685 |
259,282,326,850 |
09/2013 |
10 |
28,050,000,000 |
280,500,000,000 |
25,928,305,829 |
259,283,058,290 |
11/2013 |
10 |
28,050,000,000 |
280,500,000,000 |
25,928,390,990 |
259,283,909,900 |
| Month/Year | Remark |
||
|---|---|---|---|
Sources of Capital |
Capital Increase by Assets |
Date of Approval & Approval |
|
03/2013 |
Exercise of Employee Stock |
None |
03/11/2013 Yuan Shang Tzu |
06/2013 |
Exercise of Employee Stock |
None |
06/06/2013 Yuan Shang Tzu |
09/2013 |
Exercise of Employee Stock |
None |
09/03/2013 Yuan Shang Tzu |
11/2013 |
Exercise of Employee Stock |
None |
11/29/2013 Yuan Shang Tzu |
Capital and Shares
As of 02/28/2014
Unit: Share
| Type of Stock | Authorized Share Capital |
Total |
|||
|---|---|---|---|---|---|
Issued Shares |
Unissued |
||||
Listed |
Non-listed |
Total |
|||
Common Stock |
25,929,049,937 |
0 |
25,929,049,937 |
2,120,950,063 |
28,050,000,000 |
Shelf Registration: None.
Composition of Shareholders
As of 07/09/2013 (last record date)
Common Share
| Type of Shareholders | Government |
Financial |
Other Juridical |
Foreign |
Domestic Natural |
Total |
|---|---|---|---|---|---|---|
Number of |
10 |
234 |
1,023 |
3,341 |
359,899 |
364,507 |
Shareholding |
1,653,712,458 |
738,531,978 |
1,127,435,779 |
20,023,387,265 |
2,385,238,349 |
25,928,305,829 |
Holding |
6.38% |
2.85% |
4.35% |
77.22% |
9.20% |
100.00% |
Distribution Profile of Share Ownership
As of 07/09/2013 (last record date)
Common Share
| Shareholder Ownership (Unit: Share) | Number of Shareholders |
Ownership |
Ownership (%) |
|---|---|---|---|
1 ~ 999 |
171,105 |
38,623,504 |
0.15% |
1,000 ~ 5,000 |
130,752 |
284,996,435 |
1.10% |
5,001 ~ 10,000 |
28,306 |
200,375,733 |
0.77% |
10,001 ~ 15,000 |
11,294 |
136,512,854 |
0.53% |
15,001 ~ 20,000 |
4,922 |
85,892,113 |
0.33% |
20,001 ~ 30,000 |
5,565 |
134,811,854 |
0.52% |
30,001 ~ 40,000 |
2,644 |
91,015,467 |
0.35% |
40,001 ~ 50,000 |
1,621 |
72,830,364 |
0.28% |
50,001 ~ 100,000 |
3,222 |
223,963,582 |
0.86% |
100,001 ~ 200,000 |
1,702 |
234,597,317 |
0.90% |
200,001 ~ 400,000 |
1,096 |
308,623,163 |
1.19% |
400,001 ~ 600,000 |
430 |
209,759,142 |
0.81% |
600,001 ~ 800,000 |
258 |
181,133,766 |
0.70% |
800,001 ~ 1,000,000 |
205 |
184,443,995 |
0.71% |
Over 1,000,001 |
1,385 |
23,540,726,540 |
90.80% |
Total |
364,507 |
25,928,305,829 |
100.00% |
Preferred Share: None.
Major Shareholders
As of 07/09/2013 (last record date)
Common Share
| Shareholders | Total Shares Owned |
Ownership (%) |
|---|---|---|
ADR-Taiwan Semiconductor Manufacturing Company, Ltd. |
5,456,754,818 |
21.05% |
National Development Fund, Executive Yuan |
1,653,709,980 |
6.38% |
JPMorgan Chase Bank N.A. Taipei Branch in custody for Saudi Arabian Monetary Agency |
854,162,727 |
3.29% |
Government of Singapore |
540,394,959 |
2.08% |
JPMorgan Chase Bank N.A. Taipei Branch in custody for EuroPacific Growth Fund |
425,265,136 |
1.64% |
JPMorgan Chase Bank N.A. Taipei Branch in custody for ABU DHABI Investment Authority |
329,478,439 |
1.27% |
JPMorgan Chase Bank N.A. Taipei Branch in custody for Norges Bank |
274,910,515 |
1.06% |
iShares MSCI Emerging Markets Index Fund |
246,339,000 |
0.95% |
Vanguard Emerging Markets Stock Index Fund, a Series of Vanguard International Equity Index Funds |
235,633,845 |
0.91% |
JPMorgan Chase Bank, N.A., Taipei Branch in Custody for Stichting Depositary APG Emerging Markets Equity Pool |
232,312,361 |
0.90% |
Net Change in Shareholding and Shares Pledged by Directors, Management and Shareholders with 10% Shareholdings or More
Unit: Share
| Title Name |
2013 |
01/01/2014 ~ 02/28/2014 |
||
|---|---|---|---|---|
Net Change in |
Net Change in Shares |
Net Change in |
Net Change in Shares |
|
Chairman |
- |
- |
2,000,000 |
- |
Vice Chairman |
(190,000) |
- |
- |
- |
Director Representative: Johnsee Lee |
- |
- |
- |
- |
- |
- |
- |
- |
|
Director |
(930,000) |
- |
(50,000) |
- |
Independent Director |
- |
- |
- |
- |
Independent Director |
- |
- |
- |
- |
Independent Director |
- |
- |
- |
- |
Independent Director |
- |
- |
- |
- |
Independent Director |
- |
- |
- |
- |
President and Co-Chief Executive Officer |
(125,000) |
- |
(25,000) |
- |
President and Co-Chief Executive Officer |
276,882 |
- |
- |
- |
Executive Vice President and Co-Chief Operating Officer |
(50,000) |
- | N/A |
N/A |
Senior Vice President and Chief Information Officer |
(570,000) |
- |
(140,000) |
- |
Senior Vice President and General Counsel |
(12,290) |
- |
- |
- |
Senior Vice President, Chief Financial Officer and Spokesperson |
- |
- |
- |
- |
Senior Vice President |
(105,000) |
- |
N/A |
N/A |
Senior Vice President |
(381,000) |
- |
(8,000) |
- |
Senior Vice President of TSMC and |
- |
- |
- |
- |
Vice President |
(26,000) |
- |
- |
- |
Vice President and Chief Technology Officer |
(34,000) |
- |
- |
- |
Vice President |
(175,000) |
- |
(17,000) |
- |
Vice President |
- |
- |
- |
- |
Vice President |
(24,000) |
- |
N/A |
N/A |
Vice President |
(9,000) |
- |
- |
- |
Vice President |
- |
- |
- |
- |
Vice President |
(179,000) |
- |
(70,000) |
- |
Vice President |
(244,000) |
- |
- |
- |
Vice President |
- |
- |
- |
- |
Vice President |
(100,000) |
- |
- |
- |
Vice President |
20,000 |
- |
15,000 |
- |
Stock Trade with Related Party:
None.
Stock Pledge with Related Party:
None.
Related Party Relationship among Our 10 Largest Shareholders
As of 07/09/2013 (last record date)
Common Share
| Name | Current Shareholding |
Spouse & Minor |
TSMC Shareholding by Nominee Arrangement |
Name and Relationship between TSMC’s Shareholders |
||||
|---|---|---|---|---|---|---|---|---|
Shares |
% |
Shares |
% |
Shares |
% |
Name |
Relationship |
|
ADR-Taiwan Semiconductor Manufacturing Company, Ltd. |
5,456,754,818 |
21.05% |
N/A |
N/A |
N/A |
N/A |
None |
None |
National Development Fund, Executive Yuan Representative: Johnsee Lee |
1,653,709,980 |
6.38% |
N/A |
N/A |
N/A |
N/A |
None |
None |
- |
- |
N/A |
N/A |
N/A |
N/A |
None |
None |
|
JPMorgan Chase Bank N.A. Taipei Branch in custody for Saudi Arabian Monetary Agency |
854,162,727 |
3.29% |
N/A |
N/A |
N/A |
N/A |
None |
None |
Government of Singapore |
540,394,959 |
2.08% |
N/A |
N/A |
N/A |
N/A |
None |
None |
JPMorgan Chase Bank N.A. Taipei Branch in custody for EuroPacific Growth Fund |
425,265,136 |
1.64% |
N/A |
N/A |
N/A |
N/A |
None |
None |
JPMorgan Chase Bank N.A. Taipei Branch in custody for ABU DHABI Investment Authority |
329,478,439 |
1.27% |
N/A |
N/A |
N/A |
N/A |
None |
None |
JPMorgan Chase Bank N.A. Taipei Branch in custody for Norges Bank |
274,910,515 |
1.06% |
N/A |
N/A |
N/A |
N/A |
None |
None |
iShares MSCI Emerging Markets Index Fund |
246,339,000 |
0.95% |
N/A |
N/A |
N/A |
N/A |
None |
None |
Vanguard Emerging Markets Stock Index Fund, a Series of Vanguard International Equity Index Funds |
235,633,845 |
0.91% |
N/A |
N/A |
N/A |
N/A |
None |
None |
JPMorgan Chase Bank, N.A., Taipei Branch in Custody for Stichting Depositary APG Emerging Markets Equity Pool |
232,312,361 |
0.90% |
N/A |
N/A |
N/A |
N/A |
None |
None |
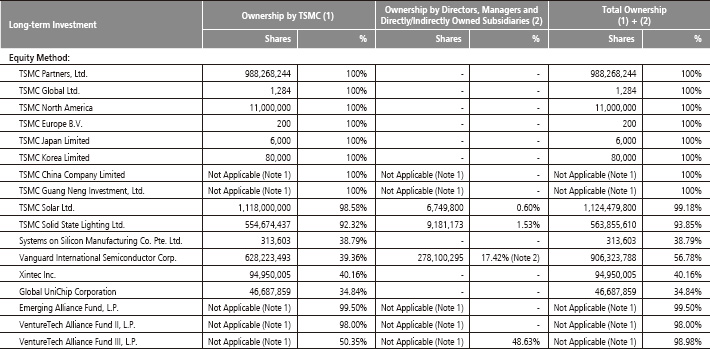
Long-term Investment Ownership
As of 12/31/2013
Share Information
TSMC’s earnings per share increased 13.3% in 2013 to NT$7.26 per share. The following table details TSMC’s net worth, earnings, dividends and market price per common share, as well as other data regarding return on investment.
Net Worth, Earnings, Dividends, and Market Price Per Common Share
Unit: NT$, except for weighted average shares and return on investment ratios
| Item | 2012 |
2013 |
01/01/2014 ~ 02/28/2014 |
|---|---|---|---|
Market Price Per Share (Note 1) |
|||
Highest Market Price |
99.20 |
115.50 |
108.50 |
Lowest Market Price |
74.30 |
94.40 |
100.50 |
Average Market Price |
84.08 |
104.09 |
105.34 |
Net Worth Per Share |
|||
Before Distribution |
27.79 |
32.69 |
- |
After Distribution |
24.79 |
(Note 5) |
- |
Earnings Per Share |
|||
Weighted Average Shares (thousand shares) |
25,927,936 |
25,929,603 |
- |
Diluted Earnings Per Share |
6.41 |
7.26 (Note 5) |
- |
Dividends Per Share |
|||
Cash Dividends |
3.00 |
3.00 (Note 5) |
- |
Accumulated Undistributed Dividend |
- |
- |
- |
Return on Investment |
|||
Price/Earnings Ratio (Note 2) |
13.12 |
(Note 5) |
- |
Price/Dividend Ratio (Note 3) |
28.03 |
(Note 5) |
- |
Cash Dividend Yield (Note 4) |
4% |
(Note 5) |
- |
Dividend Policy
TSMC’s profits may be distributed by way of cash dividend and/or stock dividend. The preferred method of distributing profits is by way of an annual cash dividend. Under TSMC’s Articles of Incorporation, stock dividends shall not exceed 50% of the total dividend distribution in any given fiscal year. TSMC does not pay dividends when there is no profit or retained earnings. TSMC has distributed cash dividends every year to its shareholders since 2004 and maintained dividends per share (DPS) at NT$3.0 every year since 2007. TSMC intends to maintain a stable dividend policy, and will consider raising DPS when the free cash flow significantly exceeds NT$3.0 per share.
Distribution of Profit
The Board adopted a proposal for 2013 profit distribution at its meeting on February 18, 2013. The proposal will be effected according to the relevant regulations, upon the approval of shareholders at the Annual Shareholders’ Meeting on June 24, 2014.
In addition, according to the Company’s Articles of Incorporation, TSMC shall allocate no more than 0.3% of earnings available for distribution (net income after a regulatory required deduction for prior years’ losses and contributions to legal and special reserves) as compensation to directors, and not less than 1% as a bonus to employees. Profit sharing to employees, to be distributed after the 2014 Annual Shareholders’Meeting, was recorded as a charge to earnings of approximately 6.7% of net income in year 2013; compensation to directors was expensed based on the estimated amount of payment. The proposal will be effected according to the relevant regulations, upon the approval of shareholders at the Annual Shareholders’ Meeting on June 24, 2014. If the actual amounts subsequently resolved by the shareholders differ from the above estimated amounts, the differences will be recorded in the year of shareholders’ resolution as a change in accounting estimate.
Proposal to Distribute 2013 Profits
Unit: NT$
Cash Dividends to Common Shareholders (NT$3.0 per share) |
77,785,851,420 |
|---|
| Note: | Employees’ cash bonus and profit sharing and compensation to directors for the year 2013 which have been expensed under the Company’s income statements are listed below: |
2012 Directors’ Compensation and Employee Profit Sharing
|
Board Resolution (02/05/2013) |
Actual Result (Note) |
|---|---|---|
Amount (NT$) |
Amount (NT$) |
|
Directors’ Compensation (Cash) |
71,351,700 |
71,351,700 |
Employee’s Cash Profit Sharing |
11,115,239,772 |
10,859,687,110 |
Total |
11,186,591,472 |
10,931,038,810 |
Impact to 2014 Business Performance and EPS Resulting from Stock Dividend Distribution:
Not applicable.
Buyback of Common Stock:
None.